Earlier this year we conducted the Savage Minds Reader Survey. Kerim described some of the demographic results in this post. Here I’ll provide a very brief recap. The majority of the responses came from readers in North America (62.8%) and Western Europe (16.7%). In terms of gender, 57% chose “female,” 43% chose “male” and two chose “other.” About 70% of the responses came from people in their 20s and 30s. Seventy six percent have either a PhD or a Master’s degree. Finally, to add one demographic detail to Kerim’s summary, when asked about their ethnicity, about 81% of the respondents chose “white” (244 out of 302 respondents).* For the rest of this post I’ll be talking about education, work (employment), and debt.
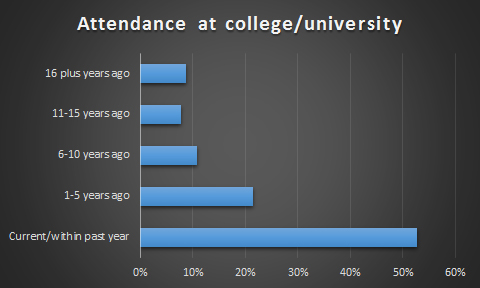
Let’s start with education. About 50% of the respondents are either currently attending college or attended during the past year (as of Spring 2015 when we did the survey). About 21% attended college between one and five years ago, 11% between six and ten years ago, and 8% between eleven and fifteen years ago. A final 8.6% attended college sixteen or more years ago (see Chart 1). Of these, 56% said they teach at the college level, while 44 percent do not. We also asked whether people plan to continue formal studies in anthropology or a related field. About 44% said they are done with formal schooling, while another 34% said they hope to get a PhD in anthropology. Another 11% said they plan on getting a Master’s in anthropology.
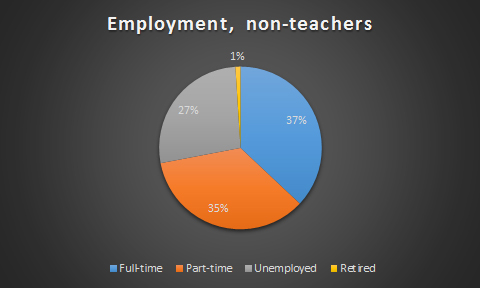
We also asked about employment–we divided this up into those who teach (or taught) at the university/college level, and those who do not. Let’s start with the latter. For those who do not teach, 37% have a full-time job, 35% work part-time, and 27% reported being unemployed. Another 1 percent are retired (see Chart 2).
For annual income (again, we are talking about the non-teachers here), about 78% of the respondents make $30,000 USD or less (I converted all non-US currency). Another 14% make between $31,000 and $60,000. Approximately 6% make between $61,000 and $100,000, and a final 3% makes $101,000 or more. Next we asked whether or not people are using their anthropology skills in their current job. About 64% said that they are using their anthropology training either directly (28%) or indirectly (36%) in their current job. About 18% said they are not using their anthropology training at all in their current job. When asked if they would prefer to be teaching at the college/university level, 43.1% chose “That’s my dream job,” 16.4% said “No way!” and 42.3% were neutral. Overall, when it comes to job satisfaction, 30.7% were satisfied, 22.8% were not, and 46.6% were in the middle. When we asked people to provide some more detail about job satisfaction, here’s what some of them wrote:
- “I enjoy using my anthropology background on how information is used in my job, even though it has nothing to do with my master’s thesis (primate-parasite interactions). It allows me to exercise my cultural anthropology muscles I would otherwise neglect.”
- “I’ve had a major in visual anthropology thus my anthropological training helps in a way in my current job but I would prefer to work in a field more related to anthropology and more intellectually challenging.”
- “My goal was to continue my research and teach at the University level. Lack of funding, getting in the field late, and mounting debt forced me to re-evaluate this goal and return to my previous job.”
- “I am a broke graduate student trying to fill the gap between my fellowships and reality with part-time work. Some has been decently lucrative but right now it is tough.”
- “I love my job and love the ability to apply my anthropological training.”
- “I aspire to academia, but have been unable to secure a postdoc and with a family to support, I can’t afford the asceticism that would allow me to spend the necessary time reading researching reflecting writing reviewing rewriting revising and resubmitting to return to the fold of academia. Nor am I really sure I want to anymore, but I do miss the collegiality and conversation.”
- “It’s hand-to-mouth and there are still embedded cultural expectations of doing a lot of work for no pay.”
- “I’d like to work somewhere where I’m being challenged.”
- “I’m interested enough in computers that I don’t hate this line of work, but I’m not talented enough for it to be anything more than a way to get by. My passion is in educating people about anthropology.”
- “Incessant mindless desk work.”
- “As an undergrad there aren’t many opportunities to build or use Anthro skills. I did apply for a summer research assistantship which has a stipend. Waiting to hear back about that. I can’t work as an unpaid intern because I have bills that need to be paid. Work-study makes $500 a month max and this is just not sustainable.”
- “Well, I do need money to sustain myself. When I returned to the US I did not have any luck finding a job as most employers said I was over-educated. I returned overseas when offered a scholarship for my MA degree, but also face issues of unemployment being overseas. “
- “Happy to be employed full time, but miss being in the field, and I am one of the few qualitative folks in a sea full of economists/statisticians.”
- “Financing for my research is on the verge of finishing. In 10 days I ll be all unemployed with part time job non related to anthropology.”
- “I am currently a graduate student in anthropology, but prior to it I worked as a research assistant and consultant for NGOs (based in Mumbai, India – because context is important!)
In my experience, anthropological (and qualitative) research needs more space to contribute to existing social programs. In a way, the research “industry” is myopic and often fails to use data and evidence efficiently to contribute to better programs.
The fact that ethnography – which can greatly contribute to this largess – rarely is at the fore of research (or is badly implemented) is disappointing.” - “I am doing mainly administrative and logistical work. My employers also value quantitative skills over qualitative skills, which can feel frustrating when my anthropological and ethnographic experience feels undervalued.”
- “I get to do research, help design things, use my anthropology and make money.”
- “I get to travel from place to place and learn about different cultures, and I’m paid handsomely to do so.”
- “I have a good job with a good employer working with mothers and their babies…what’s not to love?”
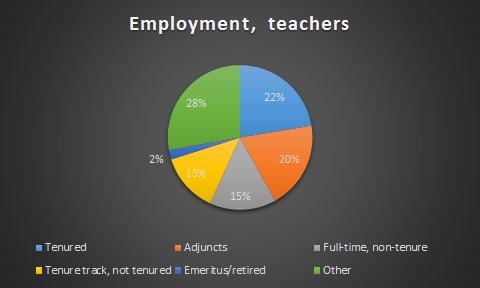
For those who do teach, 22.4% have tenure, 19.5% are adjuncts, 14.9% have a full-time, non-tenure track job. In addition, 13.3% have a tenure track job, but not tenure. Another 2% are either emeritus or retired. A final 27.8% answered “other” to this question (see Chart 3 above).** Overall, 81% of teach college students and 43% teach grad students. Another 7% percent teach at community colleges. When asked about job satisfaction, 39.8% say they are satisfied with their current employment situation, 23.2% say they are unsatisfied, and another 36.9% are on the fence. When we asked the teachers to talk more about job satisfaction, here’s what some of them wrote:
- “‘You could make more money as a butcher.’ I find myself bogged down with minutia. My job feels very precarious, even if it is the gold standard of academic employment: tenure-track job in an anth department. I worry about getting “stuck” – it’s good to have a job, but lack of mobility in the academic job market means it is difficult to look forward to advancing… I think these are probably good problems to have, but they do reduce job satisfaction. Finally, in general, I’m frustrated with the priorities of our culture and political system, which do not reward intellectual work, inquiry, research…”
- “Academia always has its ups-and-downs, but it would be stupid to complain about a tenured job at a liberal arts college.”
- “Adjuncting is not a sustainable long-term career path and with few TT jobs in the region where I live, I am likely to change careers in the long-term.”
- “Have a TT position, happy with it and my department. Definitely feelin’ lucky.”
- “Adjuncts are treated like garbage.”
- “Adjuncts need better structures and tenure track people are in a position to help this. But they seem to talk the talk in classes about Marxist thought and fair wages, yet they don’t speak up in their own departments to change the status quo.”
- “All-research museum position, teach when and what and if I want, lots of freedom to travel, write, do research, would be a dream job if the Brazilian bureaucracy weren’t such a nightmare. And if my city had sewage treatment…”
- “After finishing my Ph.D. coursework, I had to move back home to live closer to my parents who were willing to offer me financial support and were able to help my husband get a job teaching at a local high school. While working to finish my PhD qualifying exams and apply for grants, I began substitute teaching to earn a little cash and get out of the house. After finally passing my dissertation proposal defense and achieving ABD status, tight on money, I accepted a more permanent position teaching high school mathematics, replacing a teacher who left the local district in November. As college professors are not certified to teach high school, I am actually earning just above minimum wage.”
- “I am currently on the job market, without much success. The whole thing is a big mystery to me.”
- “I am extremely, unbelievably, stupendously lucky that when I was writing up my PhD, this university advertized a position in EXACTLY my specialization, and I was far enough along in writing up that they could hire me. (I submitted my PhD diss for examination the day before my job started.) I was the last of 9 tenure-track profs hired over 5 years, before a hiring freeze struck. They had the hiring process down pat and knew I’d fit in. My department is collegial, supportive and altogether a great place to be.”
- “I am underpaid, under appreciated, overworked– all for no potential job advancement. It’s way more demoralizing than I expected it to be when I signed on. To be surrounded by TT and tenured faculty who get paid 2x more plus benefits and don’t do half of the work I do for students– it’s depressing. It’s making me seriously consider leaving academia.”
- “I get to do cool research on climate change and anthro.”
- “I have a low teaching load, and good funding from my university. My colleagues are awesome.”
- “I have a tenure track position in a supportive department in an area that I like living in. Its academic happiness (a rarity).”
- “I have a wonderful TT job in an anthro dept with wonderful colleagues.”
- “I have an office, benefits, and almost enough money to cover the basics. But I’d like to teach less, write and research more, have permanent employment, tenure, and a higher salary.”
- “I love teaching at my community college. Great colleagues, love the teaching, and enjoy the students. It feels great to be part of helping those with fewer resources and opportunities get ahead and make their lives better.”
- “I teach at an R1, state university, tenured senior faculty. Good salaries, good benefits, etc. Livin’ the dream.”
- “The city in which I live is miserable: harsh winters, very little diversity, and an uber-conservative, anti-science, religious extremist, under-educated and unhealthy population. The students are by and large disappointing. Publication education has let them down, and I struggle to teach them basic skills. They make me worry about the future of our species. There are too many complacent senior faculty, and little energy on campus. There are severe budget cuts, and massive restructuring underway. I am witnessing the erosion of higher education up close, and feel there is nothing I can do about it.
- “While I have a full time, non tenure track job at the moment (1-year postdoc), I have just accepted an offer for a tenure-track job beginning fall 2015. I am very satisfied with this outcome.”
This brings us to the debt question. The total reported debt from our readers was $8,302,507. The mean for this total debt was about $19,308 per person. The mean debt of people who have at least some debt (i.e. excluding those with no debt) was $38,616. The most striking aspect of the debt stats for me was the number of people who had zero debt. Check out the breakdown (see Chart 4):
- Zero debt: 215 people (50.1%)
- Debt between $1 and $10,000: 55 (12.8%)
- Debt between $11,000 and $30,000: 66 (15.4%)
- Debt between $31,000 and $50,000: 42 (9.8%)
- Debt between $51,000 and $70,000: 25(5.8%)
- Debt between $71,000 and $90,000: 6 (1.4%)
- Debt between $91,000 and $120,000: 12 (2.8%)
- More than $120,000 in debt: 9 (2.1%)

That gap–between those with no debt at all and those with debt–speaks to some of the disparities that exist in academia (for a graphic representation of this debt gap, see Image 1). Explaining those disparities is the hard part. The largest percent of respondents fall within the $11k to $30k range, but a significant percentage of our readership has more than $30,000 in debt.

I compared debt with a few other factors to see if I could tease out any interesting differences. First, I looked at debt and ethnicity. Keep in mind that the responses for ethnicity were a bit unwieldy (as Kerim noted in his summary). What I ended up doing was reducing the responses down to “white” and “non-white.” The average debt for white respondents was $20,852, while the average debt for non-white respondents was $20,272. In terms of percentages, 46.7% of white and 50% of non-white respondents reported having at least some debt. These results do not indicate much of a difference, but considering the complexity of the ethnicity question (and trying to assess it with an opt-in online survey), this is one that could definitely be revisited.
Next I checked debt as it relates to gender. Here there were some differences. Our female readers reported an average of $20,930 in debt, while our male readers reported an average of $17,308. So this means that the female respondents carry about 21% more debt on average. This certainly isn’t definitive, but it points toward some potential differences that would merit greater attention. In addition, two people chose “other” for gender. The total debt of these two was $7,000, which translates to an average of $3,500 per person. Obviously, such a low number of responses for that category doesn’t tell us much. As with the question about ethnicity, this question could use some greater attention (and a more rigorous sample) if we really want to parse out some of these differences.

Finally, let’s talk about debt in terms of age (see Chart 5). Our readers who are 19 years old and under (4) carry an average debt of $2,500. For those in their 20s (138), the average debt is $16,010, while the respondents in their 30s (162) reported an average debt of $26,755. After that point the debt starts to drop off again: readers in their 40s (78) have an average debt of $18,381, those in their 50s (30) are remarkably lower at $5,501. The average for those in their 60s (15) jumps back up to $10,000, but here it’s important to note that 14 had no debt at all and one person reported $150,000 in debt. Finally, our three oldest readers who responded to this survey, who happen to be women in their 70s, reported having no debt at all.
I know this was a numbers-intensive post. For me the numbers are interesting, but some of the most compelling information comes from the various experiences that our readers shared in the open-ended questions. Perhaps this doesn’t come as much of a surprise, since I’m primarily a qualitative researcher (along with much of our readership). I’d like to find a way to share more of those answers–perhaps in another follow up post, or maybe even via one long catalog of responses. Let me know what you all think, since they are your answers after all. For those of you who made it all the way to the end of this long post: thanks!
UPDATE: I know this is a mass of information. I’ll add in some charts asap to help make some of the data more reader friendly. I’ve added a few already.
UPDATE II: I added some more charts and one image to help illustrate the data. I also added some tongue-in-cheek commentary to the aforementioned image. If you feel I haven’t quite hit the proper chart threshold, please let me know.
*Note: There were 430 total responses to the survey. Many people either did not respond to the ethnicity question, or left answers that were highly ambiguous (often terms of nationality that do not translate to any one particular ethnic group). I was left with 302 usable responses for this question. Answered ranged from “white” to “black” to “Latina” to “Poi dog” to “Pacific Islander,” among others.
**Note II: For this question we asked “Do you work full-time?” Since about 28% of the answers to this question were “other,” this is another question we obviously need to rethink if we end up doing another survey in the future.
Dude can you do some charts? Might make it much easier to read.
Ya–charts would be good. I’ll see if I can carve out some time to make some before the madness of the semester hits.